


Details for 2017 Financial Report (2)
(....CONTINUED) City of Eagan Statement of Revenues, Expenses, and Changes in Fund Net Position - Proprietary Funds For the Year Ended December 31, 2017 City of Eagan Statement of Cash Flows - Proprietary Funds Year Ended December 31, 2017 Published in the Burnsville-Eagan Sun Thisweek July 6, 2018 832568 & 832573
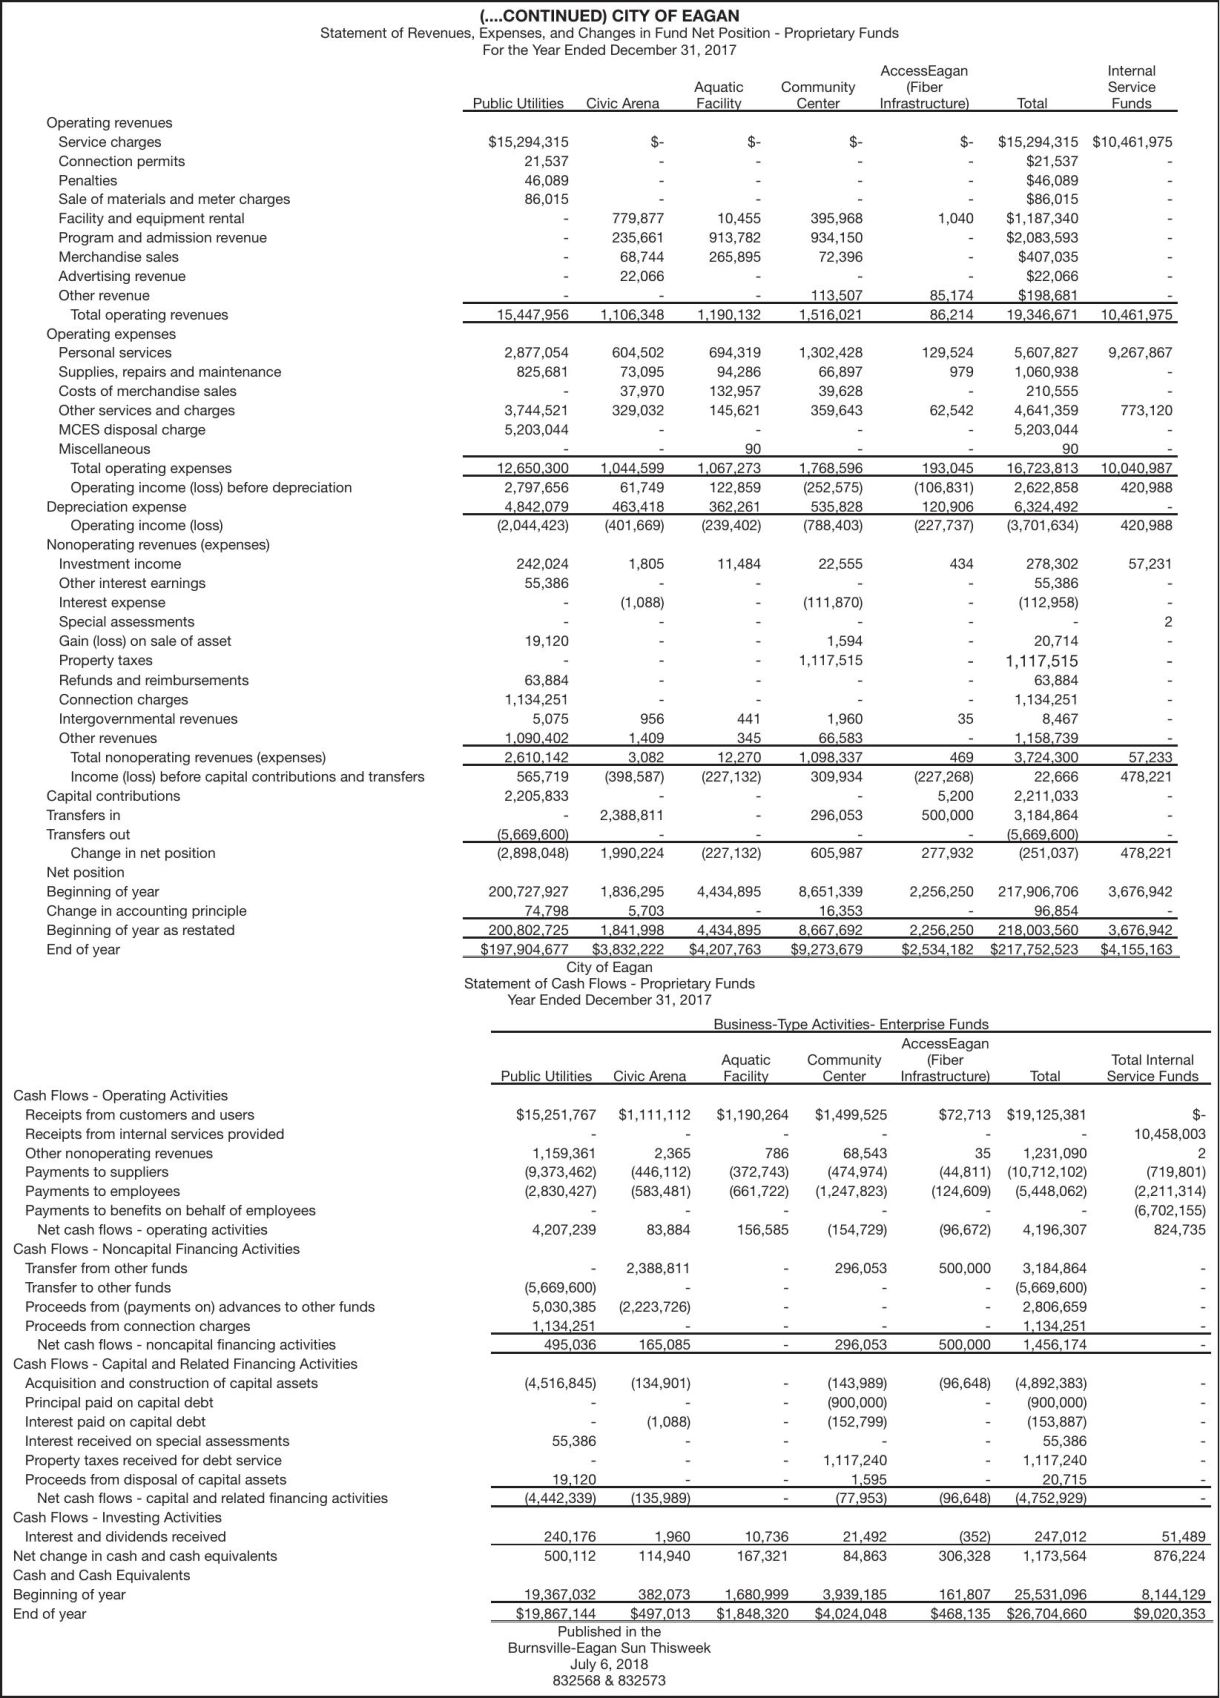
(....CONTINUED) City of Eagan

Statement of Revenues, Expenses, and Changes in Fund Net Position - Proprietary Funds
For the Year Ended December 31, 2017
AccessEagan
Aquatic
Community
(Fiber
Public Utilities
Civic Arena
Facility
Center
Infrastructure)
Operating revenues
Service charges
Connection permits
Penalties
Sale of materials and meter charges
Facility and equipment rental
Program and admission revenue
Merchandise sales
Advertising revenue
Other revenue
Total operating revenues
Operating expenses
Personal services
Supplies, repairs and maintenance
Costs of merchandise sales
Other services and charges
Mces disposal charge
Miscellaneous
Total operating expenses
Operating income (loss) before depreciation
Depreciation expense
Operating income (loss)
Nonoperating revenues (expenses)
Investment income
Other interest earnings
Interest expense
Special assessments
Gain (loss) on sale of asset
Property taxes
Refunds and reimbursements
Connection charges
Intergovernmental revenues
Other revenues
Total nonoperating revenues (expenses)
Income (loss) before capital contributions and transfers
Capital contributions
Transfers in
Transfers out
Change in net position
Net position
Beginning of year
Change in accounting principle
Beginning of year as restated
End of year

$15,294,315
21,537
46,089
86,015
15,447,956

$779,877
235,661
68,744
22,066
1,106,348

$10,455
913,782
265,895
1,190,132

$395,968
934,150
72,396
113,507
1,516,021

$1,040
85,174
86,214

2,877,054
825,681
3,744,521
5,203,044
12,650,300
2,797,656
4,842,079
(2,044,423)

604,502
73,095
37,970
329,032
1,044,599
61,749
463,418
(401,669)

694,319
94,286
132,957
145,621
90
1,067,273
122,859
362,261
(239,402)

1,302,428
66,897
39,628
359,643
1,768,596
(252,575)
535,828
(788,403)

129,524
979
62,542
193,045
(106,831)
120,906
(227,737)

5,607,827
1,060,938
210,555
4,641,359
5,203,044
90
16,723,813
2,622,858
6,324,492
(3,701,634)

9,267,867
773,120
10,040,987
420,988
420,988

242,024
55,386
19,120
63,884
1,134,251
5,075
1,090,402
2,610,142
565,719
2,205,833
(5,669,600)
(2,898,048)

1,805
(1,088)
956
1,409
3,082
(398,587)
2,388,811
1,990,224

11,484
441
345
12,270
(227,132)
(227,132)

22,555
(111,870)
1,594
1,117,515
1,960
66,583
1,098,337
309,934
296,053
605,987

434
-

278,302
55,386
(112,958)
20,714

57,231
2
-

-

1,117,515

-

35
469
(227,268)
5,200
500,000
277,932

63,884
1,134,251
8,467
1,158,739
3,724,300
22,666
2,211,033
3,184,864
(5,669,600)
(251,037)

57,233
478,221
478,221

200,727,927
1,836,295
4,434,895
74,798
5,703
200,802,725
1,841,998
4,434,895
$197,904,677
$3,832,222
$4,207,763
City of Eagan
Statement of Cash Flows - Proprietary Funds
Year Ended December 31, 2017

8,651,339
16,353
8,667,692
$9,273,679

2,256,250
2,256,250
$2,534,182

217,906,706
96,854
218,003,560
$217,752,523

3,676,942
3,676,942
$4,155,163

Public Utilities
Cash Flows - Operating Activities
Receipts from customers and users
Receipts from internal services provided
Other nonoperating revenues
Payments to suppliers
Payments to employees
Payments to benefits on behalf of employees
Net cash flows - operating activities
Cash Flows - Noncapital Financing Activities
Transfer from other funds
Transfer to other funds
Proceeds from (payments on) advances to other funds
Proceeds from connection charges
Net cash flows - noncapital financing activities
Cash Flows - Capital and Related Financing Activities
Acquisition and construction of capital assets
Principal paid on capital debt
Interest paid on capital debt
Interest received on special assessments
Property taxes received for debt service
Proceeds from disposal of capital assets
Net cash flows - capital and related financing activities
Cash Flows - Investing Activities
Interest and dividends received
Net change in cash and cash equivalents
Cash and Cash Equivalents
Beginning of year
End of year

Total

Internal
Service
Funds

Civic Arena

$15,294,315 $10,461,975
$21,537
$46,089
$86,015
$1,187,340
$2,083,593
$407,035
$22,066
$198,681
19,346,671
10,461,975

Business-Type Activities- Enterprise Funds
AccessEagan
Aquatic
Community
(Fiber
Facility
Center
Infrastructure)

Total

Total Internal
Service Funds

$15,251,767
1,159,361
(9,373,462)
(2,830,427)
4,207,239

$1,111,112
2,365
(446,112)
(583,481)
83,884

$1,190,264
786
(372,743)
(661,722)
156,585

$1,499,525
68,543
(474,974)
(1,247,823)
(154,729)

$72,713
35
(44,811)
(124,609)
(96,672)

$19,125,381
1,231,090
(10,712,102)
(5,448,062)
4,196,307

$10,458,003
2
(719,801)
(2,211,314)
(6,702,155)
824,735

(5,669,600)
5,030,385
1,134,251
495,036

2,388,811
(2,223,726)
165,085

-

296,053
296,053

500,000
500,000

3,184,864
(5,669,600)
2,806,659
1,134,251
1,456,174

-

(4,516,845)
55,386
19,120
(4,442,339)

(134,901)
(1,088)
(135,989)

-

(143,989)
(900,000)
(152,799)
1,117,240
1,595
(77,953)

(96,648)
(96,648)

(4,892,383)
(900,000)
(153,887)
55,386
1,117,240
20,715
(4,752,929)

-

240,176
500,112

1,960
114,940

10,736
167,321

21,492
84,863

(352)
306,328

247,012
1,173,564

51,489
876,224

19,367,032
382,073
1,680,999
$19,867,144
$497,013
$1,848,320
Published in the
Burnsville-Eagan Sun Thisweek
July 6, 2018
832568 & 832573

3,939,185
$4,024,048

161,807
$468,135

25,531,096
$26,704,660

8,144,129
$9,020,353


