


Details for 2017 Financial Statements
Updated
CITY OF MOUNDS VIEW Summary Financial Report The purpose of this report is to provide a summary of financial information concerning the City of Mounds View. The complete financial statements may be examined at City Hall, 2401 Mounds View Blvd. or on the Citys web site www.moundsviewmn.org/finance. Questions should be directed to Mark Beer, Finance Director (763) 717 - 4011 Revenues and Expenditures for General Operations General, Special Revenue, Debt Service, and Capital Project Funds (Governmental Funds) * - Includes long term pension obligations of $3,966,628 and $8,979,188 which are not under the control of the City. CITY OF MOUNDS VIEW Statement of Net Position Proprietary Funds December 31, 2017 CONTINUED...
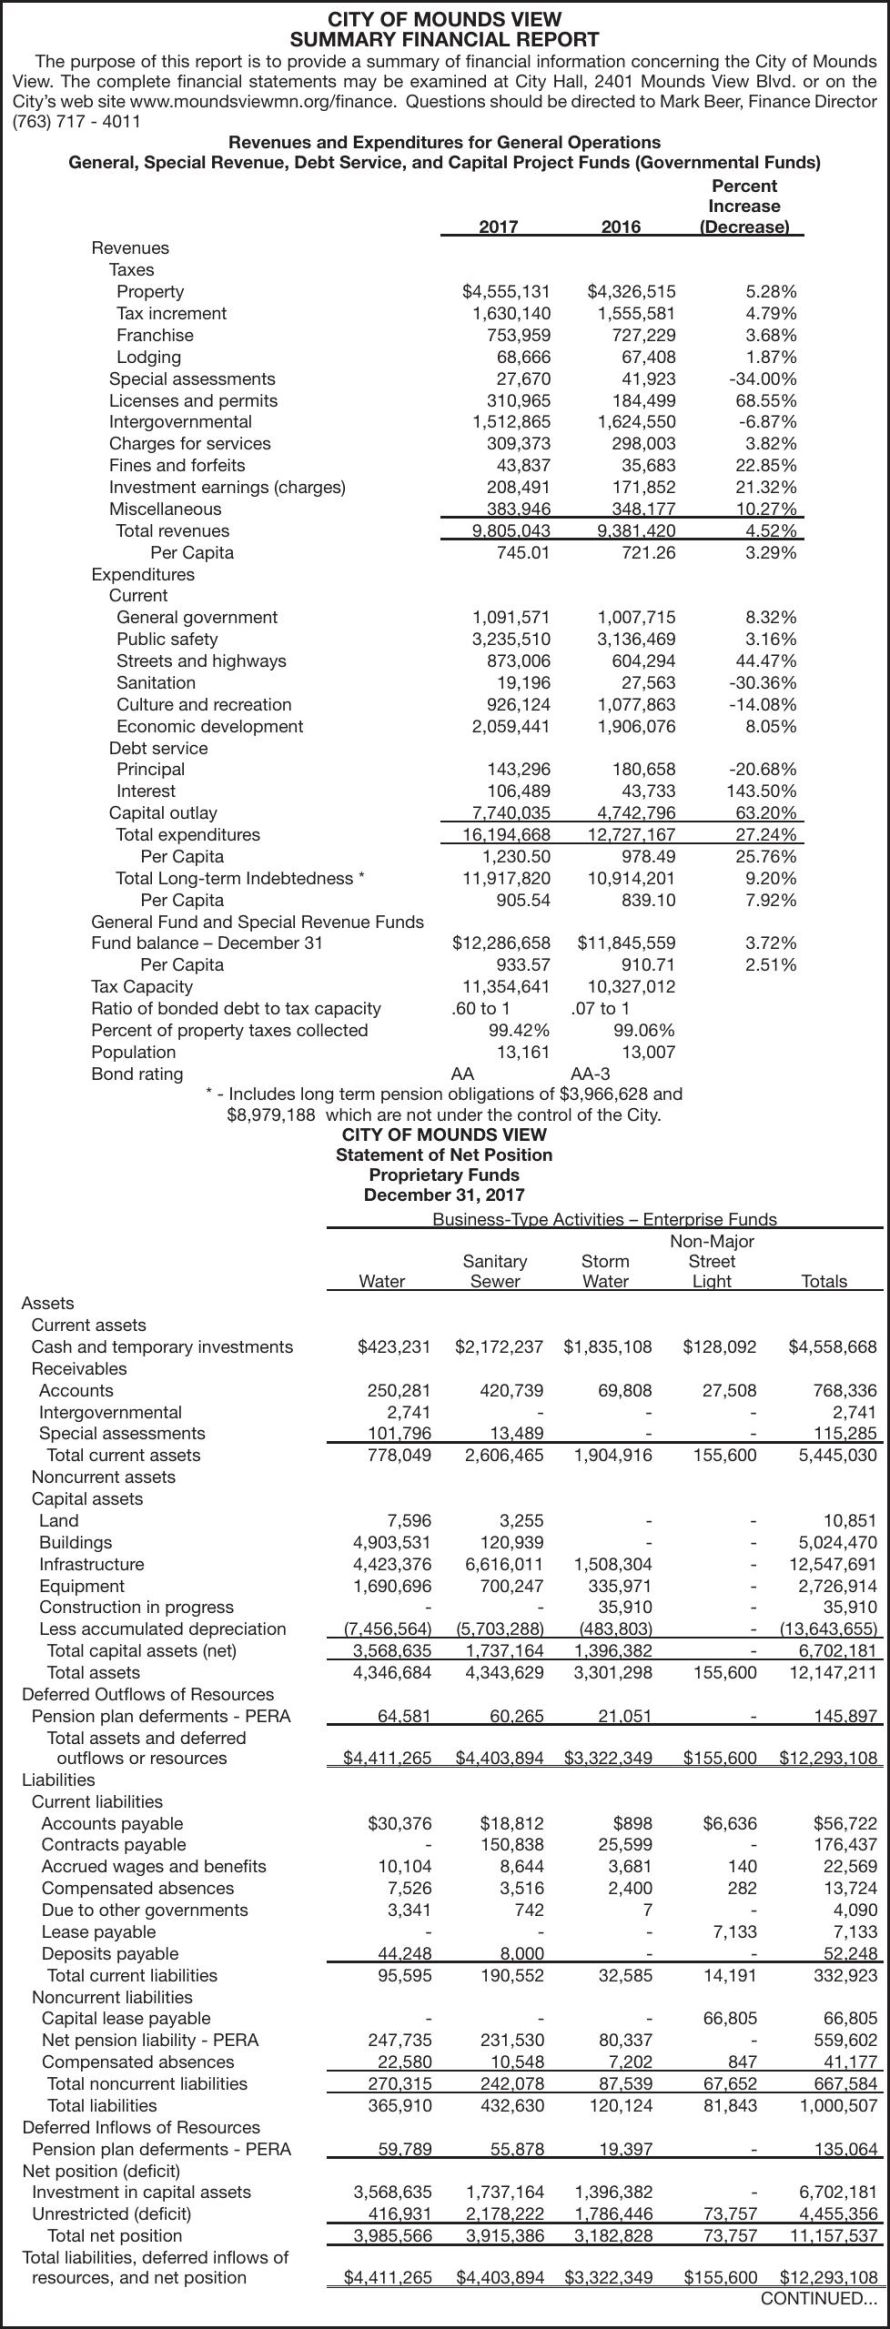
CITY OF MOUNDS VIEW
Summary Financial Report

The purpose of this report is to provide a summary of financial information concerning the City of Mounds
View. The complete financial statements may be examined at City Hall, 2401 Mounds View Blvd. or on the
City’s web site www.moundsviewmn.org/finance. Questions should be directed to Mark Beer, Finance Director
(763) 717 - 4011
Revenues and Expenditures for General Operations
General, Special Revenue, Debt Service, and Capital Project Funds (Governmental Funds)
Percent
Increase
2017
2016
(Decrease)
Revenues
Taxes
Property
$4,555,131
$4,326,515
5.28%
Tax increment
1,630,140
1,555,581
4.79%
Franchise
753,959
727,229
3.68%
Lodging
68,666
67,408
1.87%
Special assessments
27,670
41,923
-34.00%
Licenses and permits
310,965
184,499
68.55%
Intergovernmental
1,512,865
1,624,550
-6.87%
Charges for services
309,373
298,003
3.82%
Fines and forfeits
43,837
35,683
22.85%
Investment earnings (charges)
208,491
171,852
21.32%
Miscellaneous
383,946
348,177
10.27%
Total revenues
9,805,043
9,381,420
4.52%
Per Capita
745.01
721.26
3.29%
Expenditures
Current
General government
1,091,571
1,007,715
8.32%
Public safety
3,235,510
3,136,469
3.16%
Streets and highways
873,006
604,294
44.47%
Sanitation
19,196
27,563
-30.36%
Culture and recreation
926,124
1,077,863
-14.08%
Economic development
2,059,441
1,906,076
8.05%
Debt service
Principal
143,296
180,658
-20.68%
Interest
106,489
43,733
143.50%
Capital outlay
7,740,035
4,742,796
63.20%
Total expenditures
16,194,668
12,727,167
27.24%
Per Capita
1,230.50
978.49
25.76%
Total Long-term Indebtedness *
11,917,820
10,914,201
9.20%
Per Capita
905.54
839.10
7.92%
General Fund and Special Revenue Funds
Fund balance – December 31
$12,286,658
$11,845,559
3.72%
Per Capita
933.57
910.71
2.51%
Tax Capacity
11,354,641
10,327,012
Ratio of bonded debt to tax capacity
.60 to 1
.07 to 1
Percent of property taxes collected
99.42%
99.06%
Population
13,161
13,007
Bond rating
AA
AA-3
* - Includes long term pension obligations of $3,966,628 and
$8,979,188 which are not under the control of the City.
CITY OF MOUNDS VIEW
Statement of Net Position
Proprietary Funds
December 31, 2017
Business-Type Activities – Enterprise Funds
Non-Major
Sanitary
Storm
Street
Water
Sewer
Water
Light
Totals
Assets
Current assets
Cash and temporary investments
$423,231 $2,172,237 $1,835,108
$128,092
$4,558,668
Receivables
Accounts
250,281
420,739
69,808
27,508
768,336
Intergovernmental
2,741
2,741
Special assessments
101,796
13,489
115,285
Total current assets
778,049
2,606,465
1,904,916
155,600
5,445,030
Noncurrent assets
Capital assets
Land
7,596
3,255
10,851
Buildings
4,903,531
120,939
5,024,470
Infrastructure
4,423,376
6,616,011
1,508,304
12,547,691
Equipment
1,690,696
700,247
335,971
2,726,914
Construction in progress
35,910
35,910
Less accumulated depreciation
(7,456,564) (5,703,288)
(483,803)
- (13,643,655)
Total capital assets (net)
3,568,635
1,737,164
1,396,382
6,702,181
Total assets
4,346,684
4,343,629
3,301,298
155,600
12,147,211
Deferred Outflows of Resources
Pension plan deferments - PERA
64,581
60,265
21,051
145,897
Total assets and deferred
outflows or resources
$4,411,265 $4,403,894 $3,322,349
$155,600 $12,293,108
Liabilities
Current liabilities
Accounts payable
$30,376
$18,812
$898
$6,636
$56,722
Contracts payable
150,838
25,599
176,437
Accrued wages and benefits
10,104
8,644
3,681
140
22,569
Compensated absences
7,526
3,516
2,400
282
13,724
Due to other governments
3,341
742
7
4,090
Lease payable
7,133
7,133
Deposits payable
44,248
8,000
52,248
Total current liabilities
95,595
190,552
32,585
14,191
332,923
Noncurrent liabilities
Capital lease payable
66,805
66,805
Net pension liability - PERA
247,735
231,530
80,337
559,602
Compensated absences
22,580
10,548
7,202
847
41,177
Total noncurrent liabilities
270,315
242,078
87,539
67,652
667,584
Total liabilities
365,910
432,630
120,124
81,843
1,000,507
Deferred Inflows of Resources
Pension plan deferments - PERA
59,789
55,878
19,397
135,064
Net position (deficit)
Investment in capital assets
3,568,635
1,737,164
1,396,382
6,702,181
Unrestricted (deficit)
416,931
2,178,222
1,786,446
73,757
4,455,356
Total net position
3,985,566
3,915,386
3,182,828
73,757
11,157,537
Total liabilities, deferred inflows of
resources, and net position
$4,411,265 $4,403,894 $3,322,349
$155,600 $12,293,108
CONTINUED...


