


Details for 2017 Financial Report
Updated
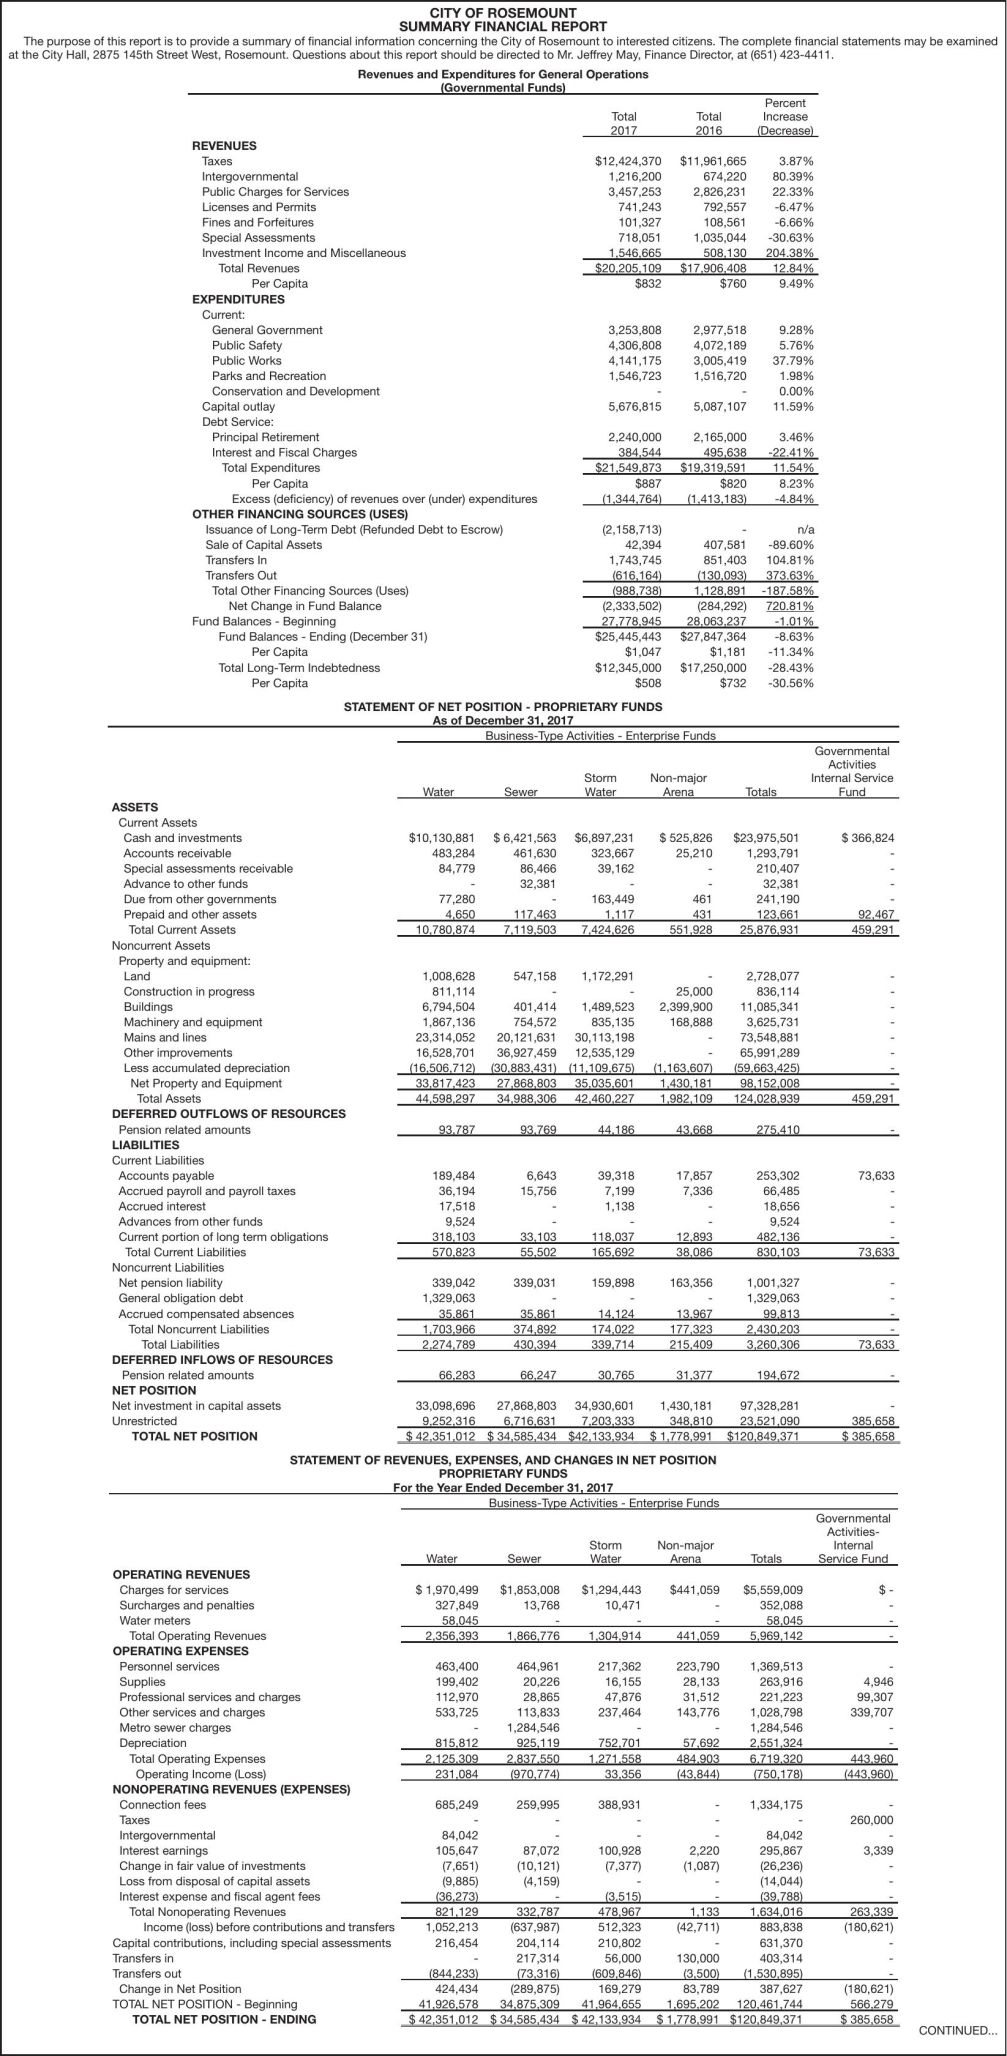
CITY OF ROSEMOUNT SUMMARY FINANCIAL REPORT The purpose of this report is to provide a summary of financial information concerning the City of Rosemount to interested citizens. The complete financial statements may be examined at the City Hall, 2875 145th Street West, Rosemount. Questions about this report should be directed to Mr. Jeffrey May, Finance Director, at (651) 423-4411. CONTINUED...
CITY OF ROSEMOUNT
SUMMARY FINANCIAL REPORT

The purpose of this report is to provide a summary of financial information concerning the City of Rosemount to interested citizens. The complete financial statements may be examined
at the City Hall, 2875 145th Street West, Rosemount. Questions about this report should be directed to Mr. Jeffrey May, Finance Director, at (651) 423-4411.
Revenues and Expenditures for General Operations
(Governmental Funds)
Total
2017
REVENUES
Taxes
Intergovernmental
Public Charges for Services
Licenses and Permits
Fines and Forfeitures
Special Assessments
Investment Income and Miscellaneous
Total Revenues
Per Capita
EXPENDITURES
Current:
General Government
Public Safety
Public Works
Parks and Recreation
Conservation and Development
Capital outlay
Debt Service:
Principal Retirement
Interest and Fiscal Charges
Total Expenditures
Per Capita
Excess (deficiency) of revenues over (under) expenditures
OTHER FINANCING SOURCES (USES)
Issuance of Long-Term Debt (Refunded Debt to Escrow)
Sale of Capital Assets
Transfers In
Transfers Out
Total Other Financing Sources (Uses)
Net Change in Fund Balance
Fund Balances - Beginning
Fund Balances - Ending (December 31)
Per Capita
Total Long-Term Indebtedness
Per Capita

Percent
Increase
(Decrease)

Total
2016

$12,424,370
1,216,200
3,457,253
741,243
101,327
718,051
1,546,665
$20,205,109
$832

$11,961,665
674,220
2,826,231
792,557
108,561
1,035,044
508,130
$17,906,408
$760

3.87%
80.39%
22.33%
-6.47%
-6.66%
-30.63%
204.38%
12.84%
9.49%

3,253,808
4,306,808
4,141,175
1,546,723
5,676,815

2,977,518
4,072,189
3,005,419
1,516,720
5,087,107

9.28%
5.76%
37.79%
1.98%
0.00%
11.59%

2,240,000
384,544
$21,549,873
$887
(1,344,764)

2,165,000
495,638
$19,319,591
$820
(1,413,183)

3.46%
-22.41%
11.54%
8.23%
-4.84%

(2,158,713)
42,394
1,743,745
(616,164)
(988,738)
(2,333,502)
27,778,945
$25,445,443
$1,047
$12,345,000
$508

407,581
851,403
(130,093)
1,128,891
(284,292)
28,063,237
$27,847,364
$1,181
$17,250,000
$732

n/a
-89.60%
104.81%
373.63%
-187.58%
720.81%
-1.01%
-8.63%
-11.34%
-28.43%
-30.56%

STATEMENT OF NET POSITION - PROPRIETARY FUNDS
As of December 31, 2017
Business-Type Activities - Enterprise Funds

Water
ASSETS
Current Assets
Cash and investments
Accounts receivable
Special assessments receivable
Advance to other funds
Due from other governments
Prepaid and other assets
Total Current Assets
Noncurrent Assets
Property and equipment:
Land
Construction in progress
Buildings
Machinery and equipment
Mains and lines
Other improvements
Less accumulated depreciation
Net Property and Equipment
Total Assets
DEFERRED OUTFLOWS OF RESOURCES
Pension related amounts
LIABILITIES
Current Liabilities
Accounts payable
Accrued payroll and payroll taxes
Accrued interest
Advances from other funds
Current portion of long term obligations
Total Current Liabilities
Noncurrent Liabilities
Net pension liability
General obligation debt
Accrued compensated absences
Total Noncurrent Liabilities
Total Liabilities
DEFERRED INFLOWS OF RESOURCES
Pension related amounts
NET POSITION
Net investment in capital assets
Unrestricted
TOTAL NET POSITION

Sewer

Storm
Water

Non-major
Arena

Totals

Governmental
Activities
Internal Service
Fund

$10,130,881
483,284
84,779
77,280
4,650
10,780,874

$ 6,421,563
461,630
86,466
32,381
117,463
7,119,503

$6,897,231
323,667
39,162
163,449
1,117
7,424,626

$ 525,826
25,210
461
431
551,928

$23,975,501
1,293,791
210,407
32,381
241,190
123,661
25,876,931

$ 366,824
92,467
459,291

1,008,628
811,114
6,794,504
1,867,136
23,314,052
16,528,701
(16,506,712)
33,817,423
44,598,297

547,158
401,414
754,572
20,121,631
36,927,459
(30,883,431)
27,868,803
34,988,306

1,172,291
1,489,523
835,135
30,113,198
12,535,129
(11,109,675)
35,035,601
42,460,227

25,000
2,399,900
168,888
(1,163,607)
1,430,181
1,982,109

2,728,077
836,114
11,085,341
3,625,731
73,548,881
65,991,289
(59,663,425)
98,152,008
124,028,939

459,291

93,787

93,769

44,186

43,668

275,410

-

189,484
36,194
17,518
9,524
318,103
570,823

6,643
15,756
33,103
55,502

39,318
7,199
1,138
118,037
165,692

17,857
7,336
12,893
38,086

253,302
66,485
18,656
9,524
482,136
830,103

73,633
73,633

339,042
1,329,063
35,861
1,703,966
2,274,789

339,031
35,861
374,892
430,394

159,898
14,124
174,022
339,714

163,356
13,967
177,323
215,409

1,001,327
1,329,063
99,813
2,430,203
3,260,306

73,633

66,283

66,247

30,765

31,377

194,672

-

33,098,696
27,868,803
34,930,601
9,252,316
6,716,631
7,203,333
$ 42,351,012 $ 34,585,434 $42,133,934

1,430,181
348,810
$ 1,778,991

97,328,281
23,521,090
$120,849,371

385,658
$ 385,658

STATEMENT OF REVENUES, EXPENSES, AND CHANGES IN NET POSITION
PROPRIETARY FUNDS
For the Year Ended December 31, 2017
Business-Type Activities - Enterprise Funds

Water
OPERATING REVENUES
Charges for services
Surcharges and penalties
Water meters
Total Operating Revenues
OPERATING EXPENSES
Personnel services
Supplies
Professional services and charges
Other services and charges
Metro sewer charges
Depreciation
Total Operating Expenses
Operating Income (Loss)
NONOPERATING REVENUES (EXPENSES)
Connection fees
Taxes
Intergovernmental
Interest earnings
Change in fair value of investments
Loss from disposal of capital assets
Interest expense and fiscal agent fees
Total Nonoperating Revenues
Income (loss) before contributions and transfers
Capital contributions, including special assessments
Transfers in
Transfers out
Change in Net Position
TOTAL NET POSITION - Beginning
TOTAL NET POSITION - ENDING

Sewer

Storm
Water

Non-major
Arena

Totals

Governmental
ActivitiesInternal
Service Fund

$ 1,970,499
327,849
58,045
2,356,393

$1,853,008
13,768
1,866,776

$1,294,443
10,471
1,304,914

$441,059
441,059

$5,559,009
352,088
58,045
5,969,142

$-

463,400
199,402
112,970
533,725
815,812
2,125,309
231,084

464,961
20,226
28,865
113,833
1,284,546
925,119
2,837,550
(970,774)

217,362
16,155
47,876
237,464
752,701
1,271,558
33,356

223,790
28,133
31,512
143,776
57,692
484,903
(43,844)

1,369,513
263,916
221,223
1,028,798
1,284,546
2,551,324
6,719,320
(750,178)

4,946
99,307
339,707
443,960
(443,960)

685,249
259,995
84,042
105,647
87,072
(7,651)
(10,121)
(9,885)
(4,159)
(36,273)
821,129
332,787
1,052,213
(637,987)
216,454
204,114
217,314
(844,233)
(73,316)
424,434
(289,875)
41,926,578
34,875,309
$ 42,351,012 $ 34,585,434

388,931
100,928
(7,377)
(3,515)
478,967
512,323
210,802
56,000
(609,846)
169,279
41,964,655
$ 42,133,934

1,334,175
84,042
2,220
295,867
(1,087)
(26,236)
(14,044)
(39,788)
1,133
1,634,016
(42,711)
883,838
631,370
130,000
403,314
(3,500)
(1,530,895)
83,789
387,627
1,695,202 120,461,744
$ 1,778,991 $120,849,371

260,000
3,339
263,339
(180,621)
(180,621)
566,279
$ 385,658

CONTINUED...


