


Details for 2017 Financials (1)
CITY OF BURNSVILLE NOTICE OF 2017 AUDITORS REPORT The 2017 Auditors Report on the financial and compliance audits for the City of Burnsville is available for general public inspection on the City of Burnsvilles website (www.burnsville.org) or at the Burnsville Municipal Offices, 100 Civic Center Parkway, Burnsville, MN 55337 during business hours from 8:00 a.m. to 4:30 p.m., Monday through Friday. Dated this 26th day of June, 2018. Macheal Collins Deputy City Clerk Annual Summary Financial Report The purpose of this report is to provide a summary of financial information concerning the City of Burnsville to interested citizens. The complete financial statements may be examined at City Hall, 100 Civic Center Parkway, Burnsville, MN 55337. Questions about this report should be directed to Kelly Strey, Finance Director, telephone (952) 895-4493. Revenues and Expenditures for General Operations (Governmental Funds) City of Burnsville Statement of Net Position Proprietary Funds December 31, 2017 City of Burnsville Statement of Revenues, Expenses, and Changes in Fund Net Position Proprietary Funds For the Year Ended December 31, 2017 CONTINUED...
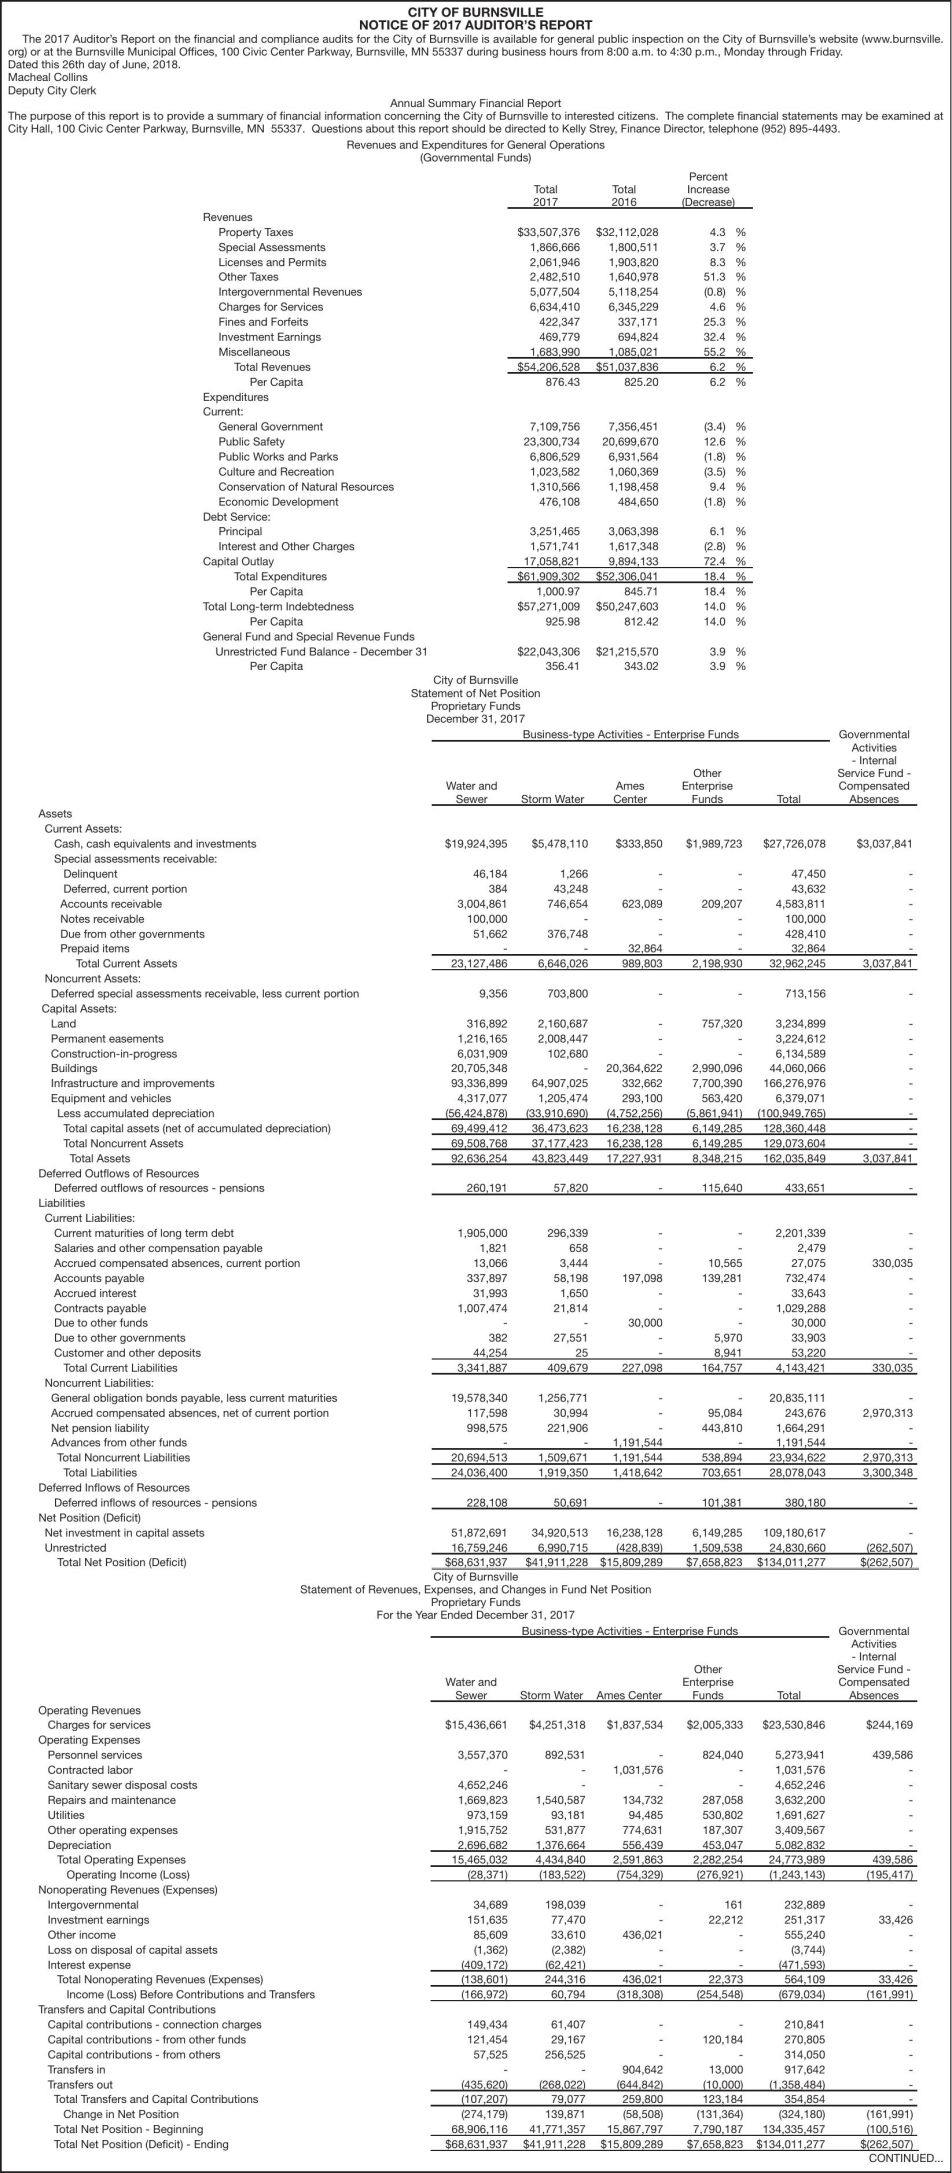
CITY OF BURNSVILLE
NOTICE OF 2017 AUDITOR’S REPORT

The 2017 Auditor’s Report on the financial and compliance audits for the City of Burnsville is available for general public inspection on the City of Burnsville’s website (www.burnsville.
org) or at the Burnsville Municipal Offices, 100 Civic Center Parkway, Burnsville, MN 55337 during business hours from 8:00 a.m. to 4:30 p.m., Monday through Friday.
Dated this 26th day of June, 2018.
Macheal Collins
Deputy City Clerk
Annual Summary Financial Report
The purpose of this report is to provide a summary of financial information concerning the City of Burnsville to interested citizens. The complete financial statements may be examined at
City Hall, 100 Civic Center Parkway, Burnsville, MN 55337. Questions about this report should be directed to Kelly Strey, Finance Director, telephone (952) 895-4493.
Revenues and Expenditures for General Operations
(Governmental Funds)

Revenues
Property Taxes
Special Assessments
Licenses and Permits
Other Taxes
Intergovernmental Revenues
Charges for Services
Fines and Forfeits
Investment Earnings
Miscellaneous
Total Revenues
Per Capita
Expenditures
Current:
General Government
Public Safety
Public Works and Parks
Culture and Recreation
Conservation of Natural Resources
Economic Development
Debt Service:
Principal
Interest and Other Charges
Capital Outlay
Total Expenditures
Per Capita
Total Long-term Indebtedness
Per Capita
General Fund and Special Revenue Funds
Unrestricted Fund Balance - December 31
Per Capita

Percent
Increase
(Decrease)

Total
2017

Total
2016

$33,507,376
1,866,666
2,061,946
2,482,510
5,077,504
6,634,410
422,347
469,779
1,683,990
$54,206,528
876.43

$32,112,028
1,800,511
1,903,820
1,640,978
5,118,254
6,345,229
337,171
694,824
1,085,021
$51,037,836
825.20

4.3
3.7
8.3
51.3
(0.8)
4.6
25.3
32.4
55.2
6.2
6.2

%
%
%
%
%
%
%
%
%
%
%

7,109,756
23,300,734
6,806,529
1,023,582
1,310,566
476,108

7,356,451
20,699,670
6,931,564
1,060,369
1,198,458
484,650

(3.4)
12.6
(1.8)
(3.5)
9.4
(1.8)

%
%
%
%
%
%

3,251,465
1,571,741
17,058,821
$61,909,302
1,000.97
$57,271,009
925.98

3,063,398
1,617,348
9,894,133
$52,306,041
845.71
$50,247,603
812.42

6.1
(2.8)
72.4
18.4
18.4
14.0
14.0

%
%
%
%
%
%
%

$22,043,306 $21,215,570
3.9 %
356.41
343.02
3.9 %
City of Burnsville
Statement of Net Position
Proprietary Funds
December 31, 2017
Business-type Activities - Enterprise Funds

Water and
Sewer
Assets
Current Assets:
Cash, cash equivalents and investments
Special assessments receivable:
Delinquent
Deferred, current portion
Accounts receivable
Notes receivable
Due from other governments
Prepaid items
Total Current Assets
Noncurrent Assets:
Deferred special assessments receivable, less current portion
Capital Assets:
Land
Permanent easements
Construction-in-progress
Buildings
Infrastructure and improvements
Equipment and vehicles
Less accumulated depreciation
Total capital assets (net of accumulated depreciation)
Total Noncurrent Assets
Total Assets
Deferred Outflows of Resources
Deferred outflows of resources - pensions
Liabilities
Current Liabilities:
Current maturities of long term debt
Salaries and other compensation payable
Accrued compensated absences, current portion
Accounts payable
Accrued interest
Contracts payable
Due to other funds
Due to other governments
Customer and other deposits
Total Current Liabilities
Noncurrent Liabilities:
General obligation bonds payable, less current maturities
Accrued compensated absences, net of current portion
Net pension liability
Advances from other funds
Total Noncurrent Liabilities
Total Liabilities
Deferred Inflows of Resources
Deferred inflows of resources - pensions
Net Position (Deficit)
Net investment in capital assets
Unrestricted
Total Net Position (Deficit)

Storm Water

Other
Enterprise
Funds

Ames
Center

Total

Governmental
Activities
- Internal
Service Fund Compensated
Absences

$19,924,395

$5,478,110

$333,850

$1,989,723

$27,726,078

$3,037,841

46,184
384
3,004,861
100,000
51,662
23,127,486

1,266
43,248
746,654
376,748
6,646,026

623,089
32,864
989,803

209,207
2,198,930

47,450
43,632
4,583,811
100,000
428,410
32,864
32,962,245

3,037,841

9,356

703,800

-

-

713,156

-

316,892
1,216,165
6,031,909
20,705,348
93,336,899
4,317,077
(56,424,878)
69,499,412
69,508,768
92,636,254

2,160,687
2,008,447
102,680
64,907,025
1,205,474
(33,910,690)
36,473,623
37,177,423
43,823,449

20,364,622
332,662
293,100
(4,752,256)
16,238,128
16,238,128
17,227,931

757,320
2,990,096
7,700,390
563,420
(5,861,941)
6,149,285
6,149,285
8,348,215

3,234,899
3,224,612
6,134,589
44,060,066
166,276,976
6,379,071
(100,949,765)
128,360,448
129,073,604
162,035,849

3,037,841

260,191

57,820

-

115,640

433,651

-

1,905,000
1,821
13,066
337,897
31,993
1,007,474
382
44,254
3,341,887

296,339
658
3,444
58,198
1,650
21,814
27,551
25
409,679

197,098
30,000
227,098

10,565
139,281
5,970
8,941
164,757

2,201,339
2,479
27,075
732,474
33,643
1,029,288
30,000
33,903
53,220
4,143,421

330,035
330,035

19,578,340
117,598
998,575
20,694,513
24,036,400

1,256,771
30,994
221,906
1,509,671
1,919,350

1,191,544
1,191,544
1,418,642

95,084
443,810
538,894
703,651

20,835,111
243,676
1,664,291
1,191,544
23,934,622
28,078,043

2,970,313
2,970,313
3,300,348

228,108

50,691

-

101,381

380,180

-

51,872,691
34,920,513
16,238,128
6,149,285
16,759,246
6,990,715
(428,839)
1,509,538
$68,631,937
$41,911,228 $15,809,289
$7,658,823
City of Burnsville
Statement of Revenues, Expenses, and Changes in Fund Net Position
Proprietary Funds
For the Year Ended December 31, 2017
Business-type Activities - Enterprise Funds

109,180,617
24,830,660
$134,011,277

(262,507)
$(262,507)

Water and
Sewer
Operating Revenues
Charges for services
Operating Expenses
Personnel services
Contracted labor
Sanitary sewer disposal costs
Repairs and maintenance
Utilities
Other operating expenses
Depreciation
Total Operating Expenses
Operating Income (Loss)
Nonoperating Revenues (Expenses)
Intergovernmental
Investment earnings
Other income
Loss on disposal of capital assets
Interest expense
Total Nonoperating Revenues (Expenses)
Income (Loss) Before Contributions and Transfers
Transfers and Capital Contributions
Capital contributions - connection charges
Capital contributions - from other funds
Capital contributions - from others
Transfers in
Transfers out
Total Transfers and Capital Contributions
Change in Net Position
Total Net Position - Beginning
Total Net Position (Deficit) - Ending

Other
Enterprise
Funds

Total

Governmental
Activities
- Internal
Service Fund Compensated
Absences

Storm Water

Ames Center

$15,436,661

$4,251,318

$1,837,534

$2,005,333

$23,530,846

$244,169

3,557,370
4,652,246
1,669,823
973,159
1,915,752
2,696,682
15,465,032
(28,371)

892,531
1,540,587
93,181
531,877
1,376,664
4,434,840
(183,522)

1,031,576
134,732
94,485
774,631
556,439
2,591,863
(754,329)

824,040
287,058
530,802
187,307
453,047
2,282,254
(276,921)

5,273,941
1,031,576
4,652,246
3,632,200
1,691,627
3,409,567
5,082,832
24,773,989
(1,243,143)

439,586
439,586
(195,417)

34,689
151,635
85,609
(1,362)
(409,172)
(138,601)
(166,972)

198,039
77,470
33,610
(2,382)
(62,421)
244,316
60,794

436,021
436,021
(318,308)

161
22,212
22,373
(254,548)

232,889
251,317
555,240
(3,744)
(471,593)
564,109
(679,034)

33,426
33,426
(161,991)

149,434
121,454
57,525
(435,620)
(107,207)
(274,179)
68,906,116
$68,631,937

61,407
29,167
256,525
(268,022)
79,077
139,871
41,771,357
$41,911,228

904,642
(644,842)
259,800
(58,508)
15,867,797
$15,809,289

120,184
13,000
(10,000)
123,184
(131,364)
7,790,187
$7,658,823

210,841
270,805
314,050
917,642
(1,358,484)
354,854
(324,180)
134,335,457
$134,011,277

(161,991)
(100,516)
$(262,507)
CONTINUED...


